Engage
- Ask students if they know how a budget works. Point out that with a balanced budget, the same amount of money goes in and comes out. (Optional: Use a double balance scale to represent a balanced budget and show what happens if you add or subtract weights.)
- Explain that many things in nature operate in a manner similar to a budget, including the balance of radiant energy from the sun coming into and leaving the Earth’s system. If the Earth’s radiant energy budget becomes unbalanced, it can cause the climate to heat up or cool down. Point out that throughout the Earth’s history, there have been times of colder or warmer climates.
- Ask students what an ice age is. Discuss what might happen in the Earth’s budget in order for an ice age to occur.
- Ask the students what they hear about the Earth’s radiant energy budget today. Answers will vary, but most will say it is out of balance, meaning the Earth is retaining more heat then it loses. Remind students that in looking at changes to the Earth’s radiant budget, we aren’t just looking at the past year, but at the pattern over many, many years. Invite students to write in their journals what they think may be the cause of these changes.

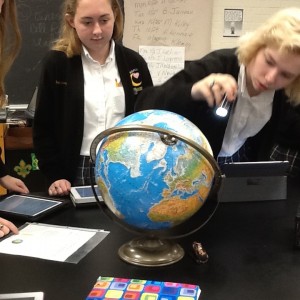
These students at Station 3 are learning about how changes in tilt of the Earth’s axis can affect climate.
Photo credit: Ann Smart
Explore
- Explain that students will be looking at some of the natural ways the Earth’s energy budget has been altered in the past, leading to changes in the climate.
- Divide the students into small groups, and give them time to visit each of the stations. For each, they should conduct the activity described on the station card, and complete that section of the Changes in Earth’s Climate student page.
Explain
- Invite each group to share the key points they included in their answers to each of the “What Do You Think?” questions. Possible correct answers include:
- Station 1 – The Earth’s wobble doesn’t affect the total amount of solar energy received by the Earth, but it does affect which part of the Earth receives more of it. Depending on the angle, the wobble can alter the intensity of the seasons in one hemisphere compared with the other.
- Station 2 – In periods when the Earth’s orbit is more oval, there are greater fluctuations between seasons as the Earth is closer or further away from the sun at different times of the year. But the average solar energy the Earth receives over the course of a year is the same.
- Station 3 – When Earth’s tilt changes, the seasons can become exaggerated. More tilt means more severe seasons—warmer summers and colder winters; less tilt means less severe seasons—cooler summers and milder winters.
- Station 4 – Erupting volcanoes emit ash and other particles into the atmosphere, which cause more of the sun’s energy to reflect back into space. This can cause an overall decrease of global temperatures for a period after the eruption.
- Station 5 – Changes in the brightness of the sun due to sunspots can influence Earth’s climate from decade to decade. This can lead to slightly cooler temperatures.
- Station 6 – Higher levels of CO2 and other greenhouse gases increase the greenhouse effect. This makes the Earth warmer, affecting Earth’s overall temperature and weather patterns worldwide.
- Share with students the Causes of Climate Change student page, pointing out the different elements of the graph. Invite them to discuss in their groups what conclusions they can draw from the graph. Ask volunteers to share from their group’s discussion.
- Conduct a formative assessment by asking students to reflect on what they have learned about the past causes of global climate change, and to write one or two paragraphs about it in their lab notebook or journal.
Elaborate
- Explain that most scientists today believe that extra carbon dioxide and other greenhouse gases in our atmosphere are speeding up a natural warming trend. Explain that students will have the opportunity to explore and analyze carbon dioxide data. They will then decide which explanation for climate change they support and prepare an argument (with claim, evidence and reasoning) justifying their position.
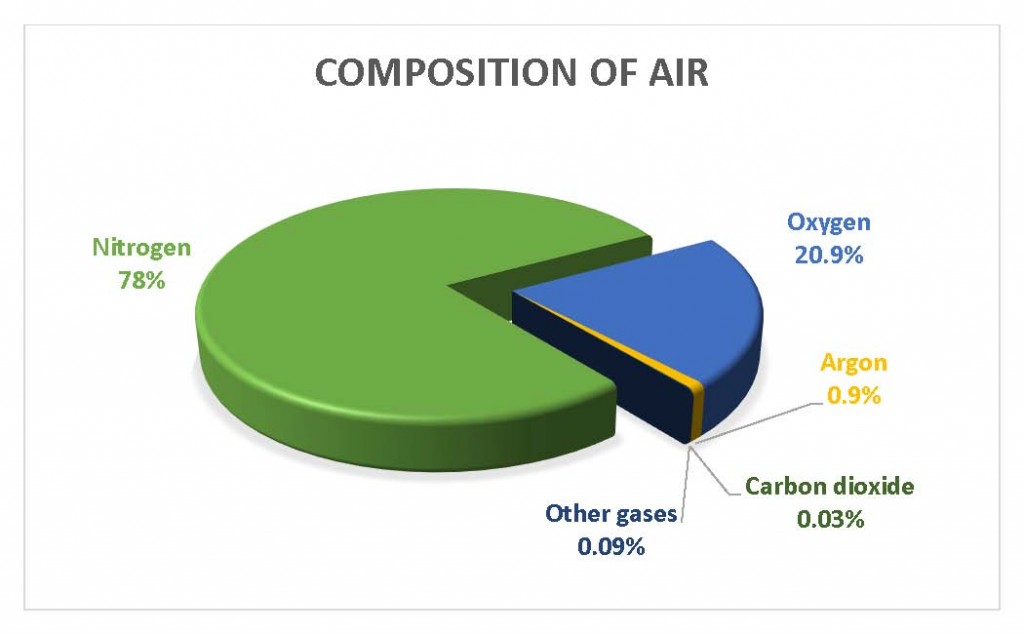
- Ask students to name some of the gases that are found in air (nitrogen, oxygen, argon, carbon dioxide, and rare gases such as helium, neon, and radon). Ask them what percentage of air they think nitrogen, oxygen, argon, and carbon dioxide (CO2) make up. (Air is about 78% nitrogen, 20% oxygen, 0.9% argon, and 0.03% carbon dioxide. Rare gases, including helium, krypton, neon, xenon, and radon together make up 0.09%. You may want to share a graph, such as the one below, of the composition of air.) Explain that students will be examining the concentration of carbon dioxide in the atmosphere over time.
- Tell the students that they will visit several different websites, looking for the relationship between increased atmospheric carbon dioxide levels and average air temperatures. Share the links to the websites you have identified as being suitable for your students (see Getting Ready.) Students will need to cite each website they use. If possible, they should copy the graphs they use comparing carbon dioxide and temperatures. Have the students visit as many sites as time permits. (Note: If Internet access is limited, you may choose to have students use data included on the Mauna Loa Data student page.)
- After they research carbon dioxide data, have students make posters summarizing the data they found. They can include both text and any graphs or data they referenced. They may also choose to organize their posters into four quadrants: Question, Claim, Evidence, and Reasoning.
- Discuss:
- What pattern do you notice in the graphs?
- What pattern do you notice within each year? What could potentially cause this pattern?
- What factors might contribute to these patterns?
- What do you predict the CO2 concentration will be in the year 2020? What assumptions did you make to arrive at this prediction? What impact might this have on climatic conditions?


