What Is Climate? — Tools
Student Pages
Teacher Pages
Additional Resources
What Is Climate? — Enrich
Option 1: Using a map of forests in your state or region, plan a road trip that goes through as many different forest zones as possible.
Option 2: Design an experiment to see the effect of temperature or moisture on different plants. For example, put a conifer leaf (pine needle), a rhododendron leaf, and a lettuce leaf in the freezer (less than 0°C [32°F]) or in the oven at on low heat (less than 125ºC [200ºF]). Compare the leaves after a few minutes. Or observe what happens to plants under various moisture and temperature conditions.
Option 3: Invite a local TV meteorologist—or another climate expert—to speak to your class about climate and weather either in person or via videoconference.
See Additional Resources for more ideas to enrich this activity.
What Is Climate? — Evaluate
Option 1: – After finishing the activity, have students complete this 6-question quiz to check their understanding. The quiz asks questions about the differences between weather and climate, what forests can tell us about climate, and the five major climate groupings.
To grant students access, simply provide them with this abbreviated, case-sensitive link: bit.ly/WhatIsClimate. For troubleshooting tips, visit the Carbon & Climate Introduction or Technical Support page.
Option 2: Have groups write responses to the following questions in their lab journals or on scrap paper. They should be prepared to discuss their answers with the class. Use a rubric, such as the What Is Climate? Evaluation Rubric teacher page, to assess their work.
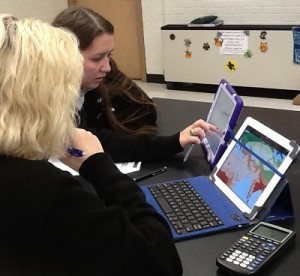
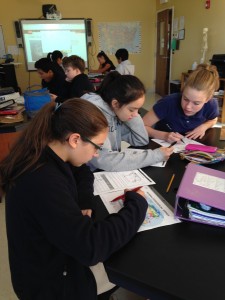
Students describe the factors that influence climate in different regions of the world.
Photo Credit: Ann Smart
- What factors influence the climate of an area? (Possible answers include temperature, precipitation, how close the location is to the ocean or the center of a continent, prevailing winds, mountains, latitude, and elevation.)
- How does the climate influence the type of forest in a region? (Possible answers should include that the life forms in a particular ecozone will be ones that can thrive on the amount of moisture and within the temperature range available there.)
You might have one person be the spokesperson who explains their group’s reasoning. The other group members rotate to at least two other groups and compare answers. They then return to their original groups and discuss what they learned from the groups they visited, and change or modify any answers.
Option 3: Have students write out their answer to the following questions, using a rubric such as the What is Climate? Evaluation Rubric teacher page to assess their work:
- If you were to randomly place your finger on a map of the world, with what certainty might you predict the climate of the place you land? Could you predict the ecological zone? Why or why not?
- Randomly place your finger on a spot on the Global Ecozones Map. Predict what would happen to the forest if the climate were to change in this area by a slight rise in temperature. (Be sure to include precipitation in your prediction.)
What Is Climate? — Doing the Activity
Engage
- Ask students what they think the differences are between weather and climate.
- Provide students with one month’s local weather data by giving them copies of the monthly calendar you printed out, directing them to the Weather Underground Historical Weather page for your area, or having them collect temperature and precipitation data for your area (see Getting Ready).
- Using the Weather vs. Climate student page, guide students to examine the actual weather and compare it with the average weather by counting the number of days of the month when it was colder or warmer than average and the number of days when it was wetter or drier.
- Discuss student findings and climate in general, posing such questions as:
-
- Was this month generally warmer, cooler, wetter, or drier than the average weather?
- What is climate?
- What makes one climate different from another?
- How would you describe the climate where you live?
- How does climate affect people’s lives? How does it affect other living things?
Explore
- Show students the Annual Average Temperatures Map teacher page. Point out the equator and tropics on the map, and ask them for their observations about the map:
-
- What patterns do you notice?
- As you move away from the equator, what changes are apparent?
- What might cause these changes?
- Divide the class into pairs or small groups. Give each group a copy of the Global Ecozones Map student page and explain that this map shows different forest ecological zones throughout the world. As with the previous map, ask students what patterns they notice. Explain that the FAO system of forest classification uses temperature as the first criterion for classifying forests into different domains. It then uses precipitation and elevation to further classify forests into the 20 ecozones shown on the map.
- Give each group a copy of the Ecozones Defined student page, and point out that it shows the types of forests found in different areas, depending on the temperature and precipitation levels. It also shows forests at high elevations or mountain regions.
- Invite students to take a journey across the globe to explore different types of forests, giving each group a copy of the Extreme Journeys student page. Have students answer the questions on the student page using information from the maps and Ecozones Defined student page. If students have trouble differentiating some of the colors on the map, suggest that they consider which ecozone would make the most sense in a particular area given what they know about the five domains.
Explain
- After the students have completed their “journeys,” ask groups to share at least one thing they discovered through their group’s journey. Discuss these questions:
-
- What patterns did you observe as you went from place to place on the map?
- What climate factors influence the type of forest in an area? (Precipitation, temperature, latitude, and elevation.)
- What patterns did you notice related to temperature? To precipitation? To elevation?
Elaborate
- Assign groups one of the forest ecozones to explore, and either provide the Forests on the Ground student page or have them conduct their own research on the assigned ecozone (see Getting Ready). Give them copies of the Forests and Climate student pages to guide their exploration. Point out that they will focus on Part 1 in this activity, and will complete Part 2 as part of Activity 5: Are You a Big Foot?
- Invite groups to create posters, maps, or other visual representations summarizing their assigned forest ecozone to share with the class.
What Is Climate? — Background
Climate is the characteristic set of atmospheric conditions of a place over a long period of time, and is often described in terms of average temperature and average precipitation. Weather is different from climate because it is the short-term condition at a particular time and place. As climatologists often say, climate is what you expect, while weather is what you get.
Many factors influence climate, including prevailing winds, latitude, elevation, ocean currents, nearness to a large lake or ocean, and nearness to the center of a large land area or mountain ranges. These factors can interact with one another and may affect an area in different ways.
Climate influences the food we eat, the energy we use, the homes we live in, the work we do, how we travel to work, our culture and heritage, and the way we spend our spare time. It also affects the other living things in our environment. For example, most trees and plants are adapted to live in particular climate conditions.
One way to learn about climate patterns around the world and the climate in a given region is to study the forest types present there. The Food and Agriculture Organization (FAO) of the United Nations uses temperature and precipitation to classify forests of the world.[1]
Climate Groupings
First, the FAO system looks at temperature to classify forests into five basic climate groupings, known as the Köppen-Trewartha domains. Those climate groupings are defined as follows:
Tropical – Mean monthly temperature of more than 18°C (64°F) all months of the year
Subtropical – Mean monthly temperature of more than 10°C (50°F) at least 8 months of the year
Temperate – Mean monthly temperature of more than 10°C (50°F) between 4 and 8 months of the year
Boreal – Mean monthly temperature of more than 10°C (50°F) between 1 and 4 months of the year
Polar – Mean monthly temperature of less than 10°C (50°F) all months of the year
The five domains fall in rough bands parallel to the equator. Because of the relationship of the Earth to the sun, the mean monthly temperature of an area depends greatly on the area’s proximity to the equator. Higher mean temperatures are generally found along the equator, which receives the most direct sunlight. The mean monthly temperature of an area is generally lower the farther that area is from the equator, with the lowest mean temperatures occurring at or near the poles.
Ecological Zones
After looking at temperature, the FAO system next examines precipitation patterns to further distinguish forest type. Within each of the domains are forests with different levels of precipitation, ranging from desert to rainforest. The FAO has identified 20 global ecological zones or ecozones, each with distinctive precipitation patterns and vegetation types. Higher elevations can affect temperature and precipitation, and so mountain forests are considered a separate ecozone within each forest domain. The Ecozones Defined student page summarizes the 20 ecozones and the Forests on the Ground student pages describe eight ecozones, with a sample forest type within each.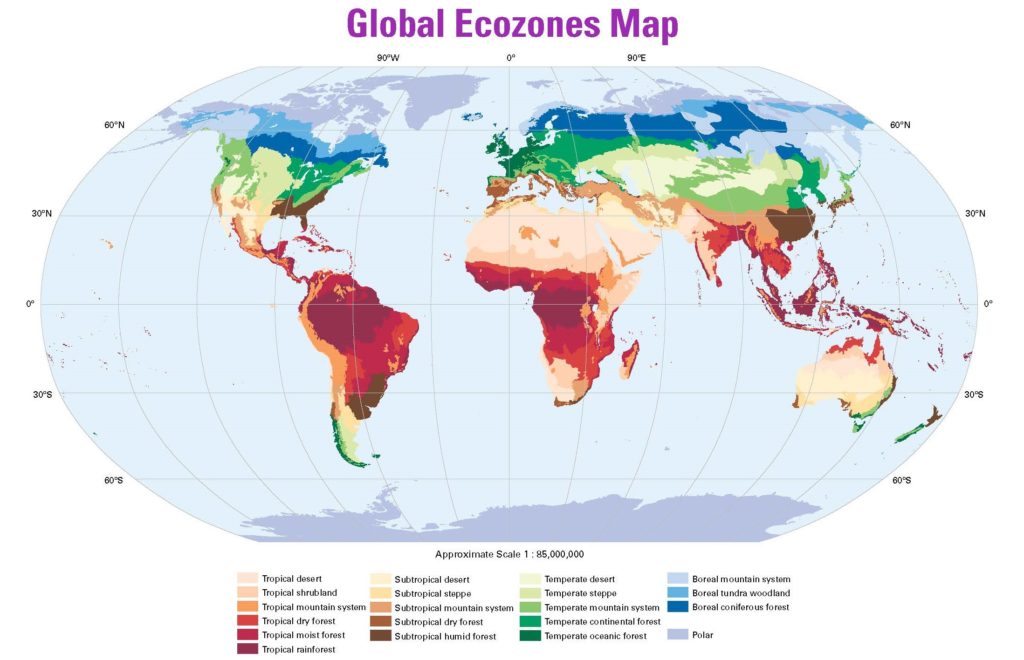
Discussion Questions
- How is climate different from weather?
- Name at least three ways that climate affects people’s lives.
- In the FAO system of forest classification, what factor differentiates the five climate domains? What secondary factor determines the 20 different ecological zones?
-
- Food and Agriculture Organization of the United Nations, Forest Department. 2001. “Approach and Principles of the FAO Ecological Zoning,” in Global Ecological Zoning of the Global Forest Resources Assessment 2000.
Food and Agriculture Organization of the United Nations, Forest Department. 2012. Global Ecological Zones for FAO Forest Reporting: 2010 Update.
- Food and Agriculture Organization of the United Nations, Forest Department. 2001. “Approach and Principles of the FAO Ecological Zoning,” in Global Ecological Zoning of the Global Forest Resources Assessment 2000.
What Is Climate? — Overview
Students explore the concept of climate as they examine global climate patterns and the relationship between temperature, precipitation, and the world’s forests.
Learner Objectives
- Students will explore the differences between weather and climate.
- Students will interpret maps to identify global climate patterns.
- Students will analyze temperature and moisture data patterns to determine their relationships to ecological zones and forest distribution.
Materials
- Annual Average Temperatures Map teacher page
- Equipment for projecting teacher page
- Monthly calendar showing actual historical and average weather statistics for your area, or weather data collected by students (see Getting Ready)
- Copies of Weather vs. Climate, one per student or group
- Copies of Global Ecozones Map, Ecozones Defined, and Extreme Journeys student pages, one set per group
- Copies of Forests and Climate and Forests on the Ground student pages, one per student or group
Time Considerations
- Getting Ready: 45 minutes
- Doing the Activity: Two to three 50-minute periods
- Evaluate: Varies, depending on option selected
Getting Ready
- Make copies of the student pages.
- Create historical weather calendars for a month or for different months in your region using the Weather Underground Historical Weather page: https://www.wunderground.com/history/. First type in your location and a date, and then on the next page select the Calendar tab. (You may want to choose dates when the differences between actual and average weather is particularly apparent.)
- (Optional) As an alternative or in addition to the Weather Underground calendars, have students collect daily temperature and precipitation data for a month using a thermometer and rain gauge.
- As an alternative or supplement to the Forests on the Ground student pages, you may plan to have students research additional forest types, either within your ecozone or within other ecozones. The Forests on the Ground pages address eight of the 20 different ecozones, providing only one example of the many different forest types that may be found within a given zone. Your students may use the Forests on the Ground page layout as a template for their own reports, and get started with their research using the two sources listed at the bottom of each page.
- See Additional Resources to find other supports for teaching this activity.
PLT Conceptual Framework
- 1.3. Patterns of variation from region to region in the Earth’s atmosphere, water, soil, climate, and geology create a wide diversity of biological communities.
- 4.2. The structure and scale of ecosystems are influenced by environmental factors such as soil type, climate, availability of water, and human activities.
Standards
See Standards Connections in the Appendices for a list of standards addressed in this activity.
