Option 1: Invite students to imagine a world where the temperature is five degrees higher than now, and predict what would happen in the region they studied.
Option 2: Have students locate the Arctic on a map or globe, and then explore changes in Arctic sea ice over time using PLT’s Arctic Sea Ice data sheet. See the National Snow and Ice Data Center website for an interactive graph of sea ice.
Option 3: Participate in Project BudBurst, a citizen science program collecting data about the effects of climate change. Look for and report the timing of different plants’ first leaf, first flower, and first fruit each year.
Option 4: During late winter or early spring in colder climates, have students observe a lake to determine what date the ice breaks up (this is known as “ice-out”). Have your students investigate historical data on “ice out” dates in your community and compare them with the date for this year. Continue collecting the data each year.
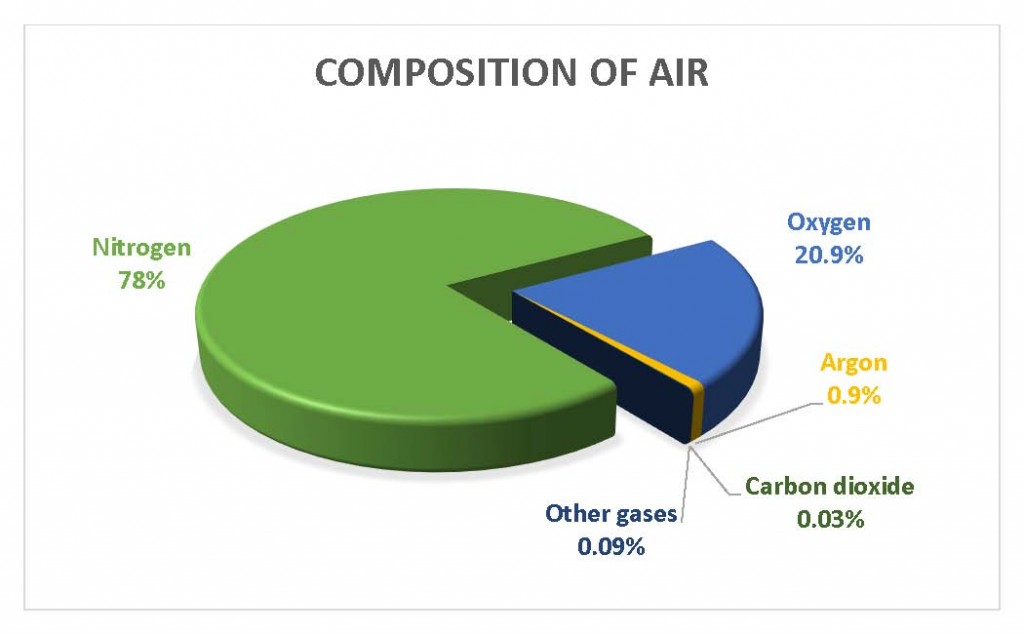
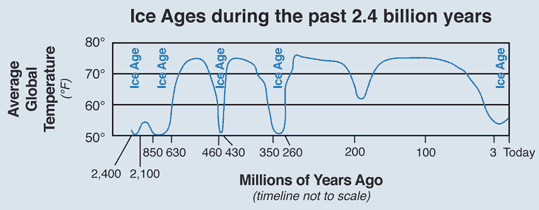
Option 5: Use an interactive tool called EarthViewer to watch Earth’s continents shifting over deep time, and explore the tool’s layers to view changes in atmospheric composition, temperature, biodiversity, day length, and solar luminosity.
See Additional Resources for more ideas to enrich this activity.
